


Diversification—It’s What’s For Dinner
Diversification is a fundamental investment strategy that involves spreading investments across various asset classes, sectors, or geographic regions with the goal of managing risk and enhancing potential returns. In our view, diversification is the underpinning of good risk management. The key is to make sure weakness or crisis in one asset class or security doesn’t derail a portfolio’s long-term objectives. Investors should benefit from three key features of proper portfolio diversification:
Risk Reduction
The most obvious benefit of diversification is its ability to offset negative returns in one area of a portfolio with positive returns in another. For example, a bad year for stocks may be a good year for bonds, or vice versa. This principle is applied across all asset classes but is largely the rationale for the classic “60/40” portfolio as historically (though not always) stock and bond prices move inversely to each other.
Enhanced Returns
Diversification can also enhance overall risk adjusted returns. By holding a variety of investments, investors can capture gains from different sectors or markets with less volatility. If one asset class underperforms, others may outperform, helping to stabilize and improve portfolio performance over time.
Psychological Comfort
Knowing that investments are spread across different assets can give investors a sense of security, reducing anxiety associated with market fluctuations. This psychological comfort can lead to better decision-making, as investors are less likely to panic and make impulsive changes to their portfolios during market downturns. Impulsive trading or portfolio changes during market tumult, such as the 2008 global financial crisis and the 2020 global pandemic, can have negative, long-lasting effects on portfolio returns.
Market timing is incredibly difficult to implement, and most will get it wrong. Diversification, in our view, is a better strategy for most investors as it steers them towards staying invested and on track.
Note on 2022
Both stocks and bonds logged negative returns in 2022 in what we call the “inflation drawdown” as the Fed had to precipitously increase interest rates to combat inflation stemming from the global pandemic, snarled global supply chains and heavy government stimulus spending. Rates had never been increased so swiftly before 2022, which had detrimental effects on investor portfolios that incorporated the tried-and-true portfolio strategy of splitting their assets into 60% equities and 40% bonds.
In this period of time, diversifying had no benefits for investors, but this inflation phenomenon should be considered an abnormality, and an exception to the diversification rule. On a go forward basis, as high interest rates and inflation come back into equilibrium, the diversification of asset classes should again regain its advantages in our view.
How Do We Account for Diversification?
The most important measure of diversification comes in the form of correlations. Correlations are a measure of how closely two separate assets track each other in performance. Most commonly, correlations are measured within a range of -1 to 1. A correlation of -1 indicates that the assets being measured move in complete opposite directions, a correlation of 1 indicates that the assets move in the exact same direction, and a correlation of 0 indicates that there is no correlation between the assets’ movement.
We consider the correlation of different assets and asset classes when determining the asset allocation (both strategic and tactical) of an investment portfolio. If certain areas of the market experience significant losses, choosing assets with high correlations would leave the portfolio fully exposed to losses with no benefit of diversification. Diversifying the holdings of a portfolio is more than adding more line items to a portfolio; it is understanding the interaction between the holdings and the impact on portfolio risk. This means that consciously selecting assets with lower correlations is necessary.
Correlations can, however, be used in the opposite way as well. If investors are confident that a certain asset class, sector, or region will perform well in a given period of time, it may be wise to select assets with higher correlations in order to capture this upside. Stock and bond correlation has gotten closer to 0 again in 2024 after a prolonged period of being positive in 2022 and 2023, giving bonds their portfolio ballast quality again.
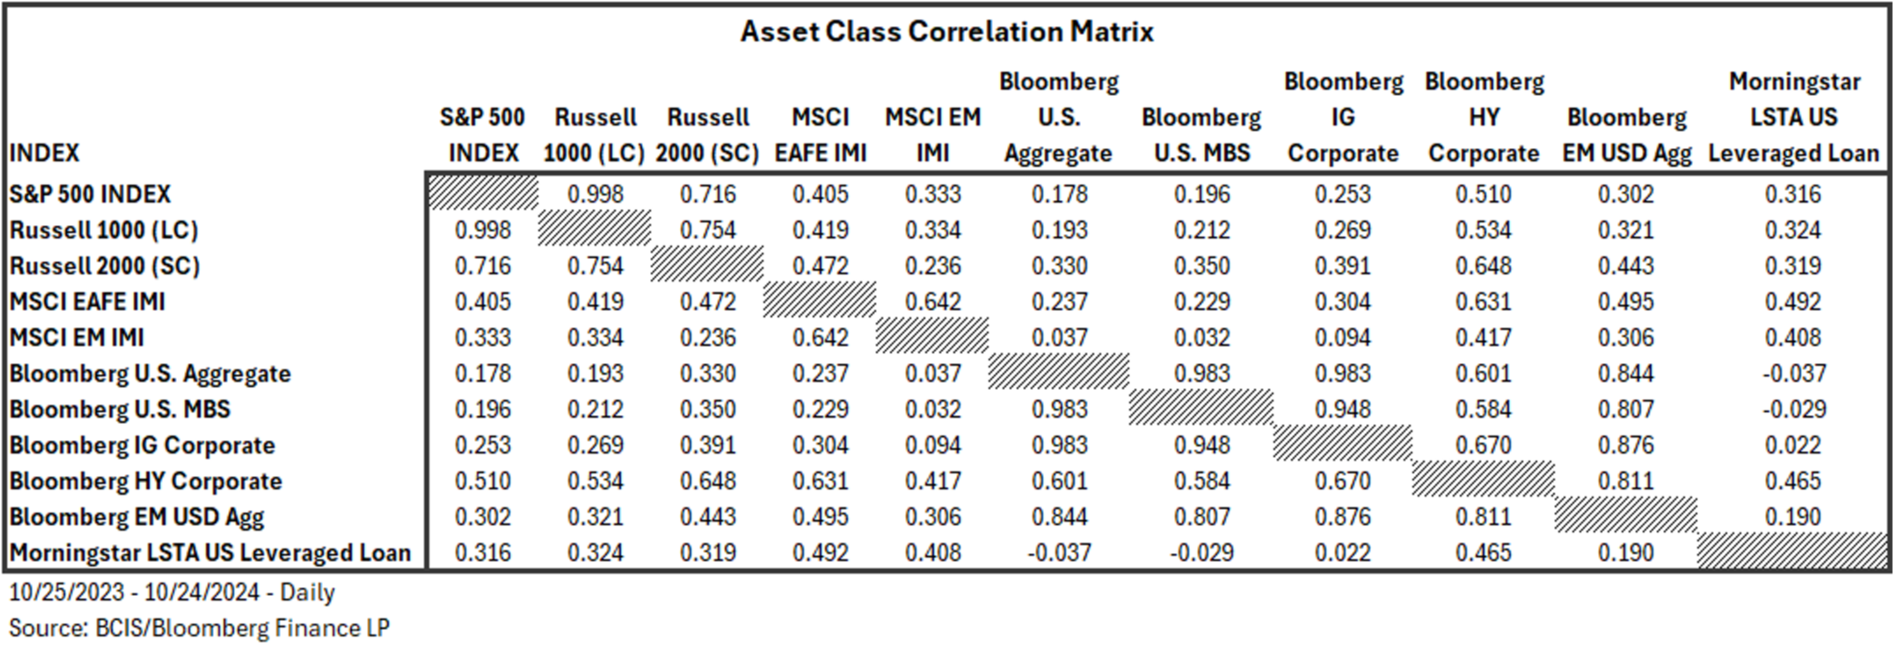
When designing a portfolio, one might consider a table similar to the one above. As an example, when building an equity component of one’s portfolio, a quick check shows that international developed equities and emerging market equities have lower correlations to the U.S. equity markets and can therefore provide diversification benefits to an equity portfolio. Of course, allocation or weighting depends on return assumptions, but one can see the benefits of including these assets in order to smooth returns over time. Similarly, you might notice the correlation between USD emerging market bonds and the U.S. high yield market. If an investor wants to allocate funds to high yield, emerging markets may be helpful as they have a higher correlation to high yield, but are influenced by differing variables and may, therefore, add some stability to a high yield allocation. These are just two examples of how correlations can be used in portfolio construction.
In these ways, diversification becomes a fundamental tool in the toolbox of an asset allocator. It is a guideline that helps prevent investors from taking on too much risk in a single area, but it also becomes a variable that can be adjusted. Our piece on market breadth deals with a specific (and current) example of this idea. By leveraging correlations, investors can quantify their diversification risk, further enhancing their ability to position themselves to reflect changing market outlooks and investment philosophies.
A diversified portfolio does not assure a profit or protect against loss in a declining market.
About Burrows Capital Advisors
Burrows Capital Advisors (“BCA”) is a leading financial advice firm. Burrows Capital Advisors offers a comprehensive range of investment management services, thoughtfully designed to manage their clients' assets, and the risks embedded in their investment portfolios. Their long-standing commitment to risk management principles underscores their dedication to helping clients achieve their financial objectives with confidence, making them a trusted partner in the investment management industry. Comprehensive services include: wealth management solutions, retirement plan solutions, advisory services, practice management support, innovative technology, marketing guidance, regulatory support, and market research.
Burrows Capital Advisors, LLC is headquartered in League City, TX in the Greater Houston metro. BCA is located at 2450 South Shore Blvd., Suite 220 League City, TX 77573.
Important Information
The views expressed in this publication are those of the author and do not necessarily reflect the views and opinions of Cetera Advisor LLC or Burrows Capital Advisors.
The information provided in this publication is for informational purposes only and is not intended as legal, financial, investment, tax, or professional advice. Nothing in this publication constitutes a solicitation, recommendation, endorsement, or offer by Burrows Capital Advisors or any affiliated entities. This publication is based on research and analysis conducted under specific circumstances and may not be applicable to all situations. It is recommended that investors conduct their own analysis or seek professional advice before making any decisions based on the information provided in this publication. The authors and publisher do not guarantee the completeness or suitability of the information contained herein and disclaim any liability for any direct, indirect, or consequential loss or damages arising from the use of, reliance on, or interpretation of this information. Any links to external websites provided in this publication are for informational purposes only and do not imply endorsement or approval of the linked content.
Investments in securities do not offer a fixed rate of return. Principal, yield and/or share price will fluctuate with changes in market conditions and, when sold or redeemed, you may receive more or less than originally invested. No system or financial planning strategy can guarantee future results. Therefore, no current or prospective client should assume that future performance or any specific investment, investment strategy or product will be profitable. Investors cannot directly invest in indices. Past performance does not guarantee future results.
Securities offered through Cetera Advisors LLC, member FINRA/SIPC. Advisory services offered through Cetera Investment Advisers LLC, a Registered Investment Adviser. Cetera firms are under separate ownership from any other named entity.
All rights are reserved. No part of this publication may be reproduced, stored in a retrieval system, or transmitted in any form or by any means, electronic, mechanical, photocopying, recording, or otherwise, without the prior written permission of the authors and publisher.
INDEX DISCLOSURES
"Investors cannot invest directly in indexes. The performance of any index is not indicative of the performance of any investment and does not take into account the effects of inflation and the fees and expenses associated with investing."
The Bloomberg USAgg Index is a broad-based flagship benchmark that measures the investment grade, US dollar-denominated, fixed-rate taxable bond market. The index includes Treasuries, government-related and corporate securities, MBS (agency fixed-rate pass-throughs), ABS and CMBS (agency and non-agency).
The Bloomberg GlobalAgg Index is a flagship measure of global investment grade debt from a multitude local currency markets. This multi-currency benchmark includes treasury, government-related, corporate and securitized fixed-rate bonds from both developed and emerging markets issuers.
The Bloomberg US Corporate Bond Index measures the investment grade, fixed-rate, taxable corporate bond market. It includes USD denominated securities publicly issued by US and non-US industrial, utility and financial issuers.
The Bloomberg US Mortgage Backed Securities (MBS) Index tracks fixed-rate agency mortgage backed pass-through securities guaranteed by Ginnie Mae (GNMA), Fannie Mae (FNMA), and Freddie Mac (FHLMC). The index is constructed by grouping individual TBA-deliverable MBS pools into aggregates or generics based on program, coupon and vintage.
The Bloomberg US Corporate High Yield Bond Index measures the USD-denominated, high yield, fixed-rate corporate bond market. Securities are classified as high yield if the middle rating of Moody's, Fitch and S&P is Ba1/BB+/BB+ or below. Bonds from issuers with an emerging markets country of risk, based on Bloomberg EM country definition, are excluded.
The Bloomberg Ba US High Yield Index measures the USD-denominated, Ba-rated, fixed-rate high-yield corporate bond market. Bonds from issuers with an emerging markets country of risk, based on Bloomberg EM country definition, are excluded.
The Emerging Market Bond Index Global (EMBI Global) was the first comprehensive EM sovereign index in the market, after the EMBI+. It provides full coverage of the EM asset class with representative countries, investable instruments (sovereign and quasisovereign), and transparent rules. The EMBI Global includes only USD-denominated emerging markets sovereign/quasi-sovereign bonds and uses a traditional, market-capitalization weighted method for country allocation.
The Morningstar LSTA US Leveraged Loan Index is a market-value weighted index designed to measure the performance of the US leveraged loan market
The MSCI ACWI captures large and mid-cap representation across 23 Developed Markets (DM) and 24 Emerging Markets (EM) countries. With 2,921 constituents, the index covers approximately 85% of the global investable equity opportunity set.
The S&P 500 is an index of 500 stocks chosen for market size, liquidity and industry grouping (among other factors) designed to be a leading indicator of U.S. equities and is meant to reflect the risk/return characteristics of the large cap universe.
The Russell 1000 Index measures the performance of the large-cap segment of the US equity universe. It is a subset of the Russell 3000® Index and includes approximately 1,000 of the largest securities based on a combination of their market cap and current index membership. The Russell 1000 represents approximately 93% of the Russell 3000® Index, as of the most recent reconstitution.
The Russell 2000 Index measures the performance of the small-cap segment of the U.S. equity universe and is a subset of the Russell 3000 Index representing approximately 10% of the total market capitalization of that index. It includes approximately 2000 of the smallest securities based on a combination of their market cap and current index membership.
The Russell 3000 Index measures the performance of the largest 3,000 U.S. companies representing approximately 98% of the investable U.S. equity market.
The Nasdaq 100 Index is a stock index of the 100 largest companies by modified market capitalization trading on Nasdaq exchanges. The index includes companies in basic materials, consumer discretionary spending, consumer staples, healthcare, industrials, technology, telecommunications, and utilities. The index excludes financial firms.
The MSCI ACWI Index is a free-float weighted equity index. The MSCI ACWI captures large and mid-cap representation across 23 Developed Markets (DM) and 24 Emerging Markets (EM) countries*. With 2,837 constituents, the index covers approximately 85% of the global investable equity opportunity set
The MSCI ACWI ex USA Index captures large and mid-cap representation across 22 of 23 Developed Markets (DM) countries (excluding the US) and 24 Emerging Markets (EM) countries*. With 2,226 constituents, the index covers approximately 85% of the global equity opportunity set outside the US.
The MSCI EAFE Index is designed to measure the equity market performance of developed markets (Europe, Australasia, Far East) excluding the U.S. and Canada. The Index is market-capitalization weighted.
The MSCI Emerging Markets Index captures large and mid-cap representation across 24 Emerging Markets (EM) countries. With 1,441constituents, the index covers approximately 85% of the free float-adjusted market capitalization in each country.