


Quick Note on Earnings
It’s not a revelation that holding equity is a wealth compounder over the long-term, not only for investors but also private business owners that hold large equity interests. Within diversified investment portfolios, equity is a building block of asset allocation along with bonds and cash.
The most important driver of shareholder value and public equity prices, in our view, is the ability of a company to generate positive cash flow for its partners or investors. Due to accounting treatments, strong cash flow isn’t always going to translate perfectly to the bottom line, but the primary goal of corporate financial managers is to grow company earnings for the benefit of their owners or shareholders.
Shareholders don’t just want a company to produce positive earnings— they want a company that can consistently grow earnings in a sustainable fashion. Within our asset allocation strategy, US large capitalization stocks are the cornerstone of the equity sleeve. This is due to our belief (as well as the market’s, given their weighting in the global indices) that these companies will be able to generate the consistent and sustainable earnings quality desired— and rewarded— by investors.
As an example, consider the mega cap technology companies, which have seen their share prices increase significantly over the past year. This performance has been due to these companies’ ability to benefit from generative AI technology and to transform this exposure into earnings and, importantly, earnings growth. As a result, these companies almost solely carried the S&P 500 Index to all-time highs in 2023 and again at the midpoint of 2024.
The amount investors are willing to pay in a valuation multiple for revenue and earnings excellence, however, is a different story. Investors will ultimately demand earnings growth that justifies the prices they are paying for shares— prices that will fall precipitously if forecasted earnings growth isn’t realized.
Quality
Analysts, mathematicians and other academics have been studying equity security return data for a long time, and many have gone on to win Nobel prizes in economics. The term equity factor is a product of said research, and it can be described simply as a specific statistical characteristic that a group of stocks have in common. These factors are then evaluated on their ability to produce returns across economic/market cycles as well as within an economic/market cycle. Factor investing is a systematic approach to evaluating companies based upon their characteristics and the return expectations – long-term or short-term – that one might expect from their shared characteristic(s).
Market capitalization is an equity factor. From 1978 until the Covid-19 pandemic in 2020, small public companies (small capitalization) outperformed large public companies (large capitalization) on an annualized basis; smaller companies are riskier to hold than their larger peers because they are in their early life cycle as a corporation and therefore have more runway for earnings growth, but also higher risk of failure. A company that began as a small cap and grow exponentially big enough to become a large cap. As the resulting inflation from the pandemic era lockdowns led the Federal Reserve to drastically increase interest rates, large cap equities have significantly outperformed their small cap peers.
Quality is another equity factor that is more nuanced and can be broken down into three general parts:
- Profitability
- Financial Strength
- Earnings Quality
Profitability indicates company performance and can be analyzed through the return-on-equity metric (among others), which is the ability of the company to generate profits using shareholder capital. Financial strength means a company is on a solid footing with enough cash flow to meet its debt obligations, capital requirements, and remain solvent through an economic downturn. Finally, earnings quality is a measure of how reliable a company’s earnings (an example of this would be economic profits versus accounting profits) are and can help forecast their future share performance.
As is evidenced by the below return heat maps by index provider MSCI, the quality factor has consistently been one of the leading factors in terms of equity returns over most longer time periods in both the USA index and global market index:
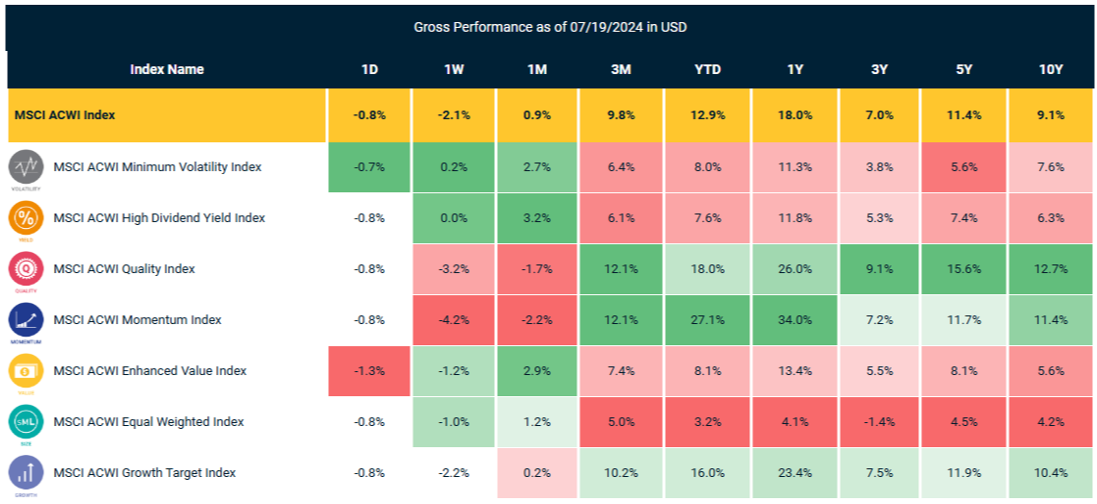
Source: MSCI Inc.
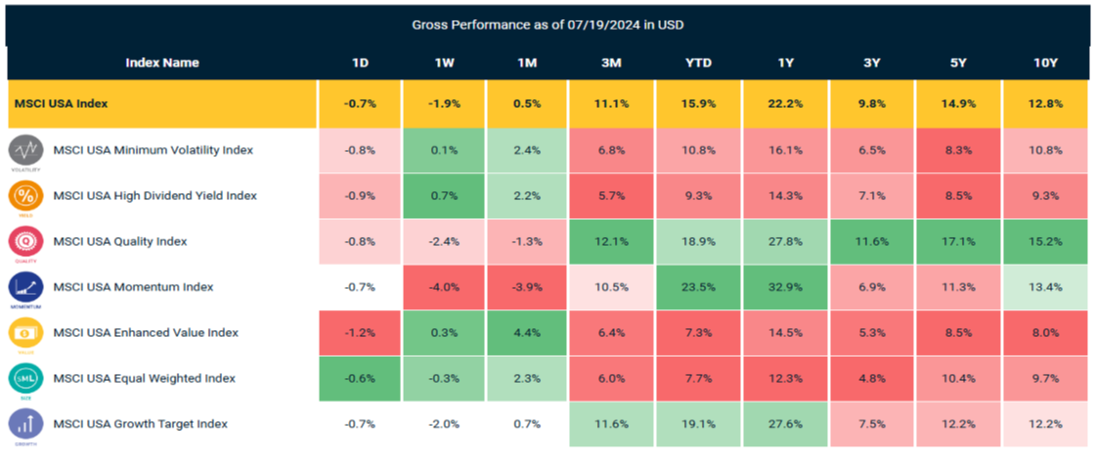
Source: MSCI Inc.
Different equity factors will, at times, outperform their peers, and it is up to market analysts to make the best educated decision on which factor to use or not use given current facts and conditions.
Taking into consideration the position we are in within the market and economic cycle; our view supports adding quality to our equity strategy. We are of the opinion that the addition of the quality factor will improve the risk/return profile of growth portfolios and/or the equity sleeve of a portfolio. We are specifically adding the quality factor to large cap equity as valuations have become full (for lack of a better term). Extended late cycle is how we would describe markets as of July 2024, and we therefore put a strong bias towards quality, which held up well over the course of the COVID-19 drawdown in 2020 and inflation drawdown in 2022.
We believe the current rally in stocks can be sustained (albeit at a slower pace) and we are in no way making “market call” on the performance of the stock market from now until the end of year, but as the economy slows, future returns may be harder to come by and it is prudent to become more selective. It is always a good time to have quality and durable companies as part of a portfolio but should the global economic and/or market environment darken, there could be a drawdown in equities, and we believe quality should add better risk-adjusted results for investors.
About Burrows Capital Investment Strategy Group
Burrows Capital Investment Strategy Group (“BCIS”) is an affiliate of Burrows Capital Advisors and majority owned by Burrows Financial Holdings. BCIS provides market perspectives, portfolio guidance, model management, and other investment services to its affiliated advisors.
Important Information
Investors cannot invest directly in indexes. The performance of any index is not indicative of the performance of any investment and does not consider the effects of inflation and the fees and expenses associated with investing.
Index Definitions
The MSCI ACWI Minimum Volatility (USD) Index aims to reflect the performance characteristics of a minimum variance strategy applied to large and mid cap equities across 23 Developed Markets (DM) and 24 Emerging Markets (EM) countries*. The index is calculated by optimizing the MSCI ACWI Index, its parent index, in USD for the lowest absolute risk (within a given set of constraints). Historically, the index has shown lower beta and volatility characteristics relative to the MSCI ACWI Index.
The MSCI ACWI High Dividend Yield Index is based on MSCI ACWI, its parent index, and includes large and mid cap stocks across 23 Developed Markets (DM) and 24 Emerging Markets (EM) countries*. The index is designed to reflect the performance of equities in the parent index (excluding REITs) with higher dividend income and quality characteristics than average dividend yields that are both sustainable and persistent. The index also applies quality screens and reviews 12-month past performance to omit stocks with potentially deteriorating fundamentals that could force them to cut or reduce dividends.
The MSCI ACWI Quality Index is based on the MSCI ACWI Index, its parent index, which includes large and mid cap stocks across 23 Developed Market (DM) and 24 Emerging Markets (EM) countries*. The index aims to capture the performance of quality growth stocks by identifying stocks with high quality scores based on three main fundamental variables: high return on equity (ROE), stable year-over year earnings growth and low financial leverage.
The MSCI ACWI Momentum Index is based on MSCI ACWI, its parent index, which includes large and mid cap stocks across 23 Developed Markets (DM) and 24 Emerging Markets (EM) countries*. It is designed to reflect the performance of an equity momentum strategy by emphasizing stocks with high price momentum, while maintaining reasonably high trading liquidity, investment capacity and moderate index turnover.
The MSCI ACWI Enhanced Value Index captures large and mid-cap representation across 23 Developed Markets (DM) countries and 25 Emerging Markets (EM) countries* exhibiting overall value style characteristics. The index is designed to represent the performance of securities that exhibit higher value characteristics relative to their peers within the corresponding GICS® sector. The value investment style characteristics for index construction are defined using three variables: Price-to-Book Value, Price-to-Forward Earnings and Enterprise Value-to-Cash flow from Operations.
The MSCI ACWI Equal Weighted Index represents an alternative weighting scheme to its market cap weighted parent index, MSCI ACWI. The index includes the same constituents as its parent (large and mid cap securities from 23 Developed Markets (DM) and 24 Emerging Markets (EM) countries*). However, at each quarterly rebalance date, all index constituents are weighted equally, effectively removing the influence of each constituent’s current price (high or low). Between rebalances, index constituent weightings will fluctuate due to price performance.
The MSCI ACWI Growth Target Index is based on the MSCI ACWI Index, its parent index, which includes 23 Developed Markets (DM) countries* and 24 Emerging Markets (EM) countries*. The index is designed to represent the performance of a strategy that seeks to capture increased exposure to the Growth factor while exhibiting lower or equal ex-ante total risk to the underlying parent index.
Important Information:
The views expressed in this publication are those of the author and do not necessarily reflect the views and opinions of Cetera Advisor LLC or Burrows Capital Advisors LLC. The information provided in this publication is for informational purposes only and is not intended as legal, financial, investment, tax, or professional advice. Nothing in this publication constitutes a solicitation, recommendation, endorsement, or offer by Burrows Capital Advisors LLC or any affiliated entities. This publication is based on research and analysis conducted under specific circumstances and may not be applicable to all situations. It is recommended that investors conduct their own analysis or seek professional advice before making any decisions based on the information provided in this publication. The authors and publisher do not guarantee the completeness or suitability of the information contained herein and disclaim any liability for any direct, indirect, or consequential loss or damages arising from the use of, reliance on, or interpretation of this information. Any links to external websites provided in this publication are for informational purposes only and do not imply endorsement or approval of the linked content. All rights are reserved. No part of this publication may be reproduced, stored in a retrieval system, or transmitted in any form or by any means, electronic, mechanical, photocopying, recording, or otherwise, without the prior written permission of the authors and publisher.
Investments in securities do not offer a fix rate of return. Principal, yield and/or share price will fluctuate with changes in market conditions and, when sold or redeemed, you may receive more or less than originally invested. No system or financial planning strategy can guarantee future results.
Securities and advisory services offered through Cetera Advisors LLC, member FINRA/SIPC, a broker/dealer and a Registered Investment Adviser. Cetera is under separate ownership from any other named entity. Burrows Capital Advisors, LLC, 2450 South Shore Blvd., Suite 220 League City, TX 77573.
Exchange-traded funds are sold only by prospectus. Please consider the investment objectives, risks, charges and expenses carefully before investing. The prospectus contains this and other information about the investment company and can be obtained from your financial professional at 2450 South Shore Blvd., Suite 220 League City, TX. Be sure to read the prospectus carefully before deciding whether to invest.