

Executive Summary
The conclusion of the U.S. presidential election and the changes to the make-up of the legislature removed some of the uncertainty plaguing the markets, and as a result, the broader markets went higher, generating positive returns in both the domestic equity and fixed income markets. On the equity side, the MSCI USA Investable Market Index was higher by 6.6 percent for the month while fixed income, measured by the Bloomberg US Aggregate Index returned slightly more than 1 percent.
Given various geopolitical events and the strength of the U.S. dollar, international markets, both developed and emerging, were broadly lower for the month. At this juncture we don’t see much from a fundamental perspective that should stand in the way of positive performance in the near term. That said, it is important to realize that “animal spirits” can only push equity valuations so far before they contract.
Monthly Recap
Way back in 1964 songwriter and poet extraordinaire, Bob Dylan, penned the following:
Come writers and critics who prophesize with your pen
And keep your eyes wide, the chance won't come again
And don't speak too soon for the wheel's still in spin
And there's no tellin' who that it's namin'
For the loser now will be later to win
'Cause the times, they are a-changin'
Indeed, the times they are a-changing. November brought to a conclusion the U.S. presidential election with the election of Donald Trump and changes to the composition of the legislature. The President-elect will, assuredly, have an impact upon the economy, and therefore global capital flows and the markets. Add to this the current (turbulent) geopolitical climate and political shifts occurring in several other countries (France, Germany, and Brazil are a few examples) and you have a recipe for uncertainty, volatility, and opportunity (change will always bring opportunity).
As a result of the changes mentioned above (weighted to the election) the expectations for the terminal federal funds rate. Below is the change over the course of the month in the federal funds December 2025 futures (used to express the terminal rate, or end of the current easing phase). As the table shows, the market added back 12 basis points (“bps”) to the terminal rate (with the month end expectation of 3.79 percent, which was lower than the highest point, which was 3.93 percent) for a cumulative 75 bps of future cuts:
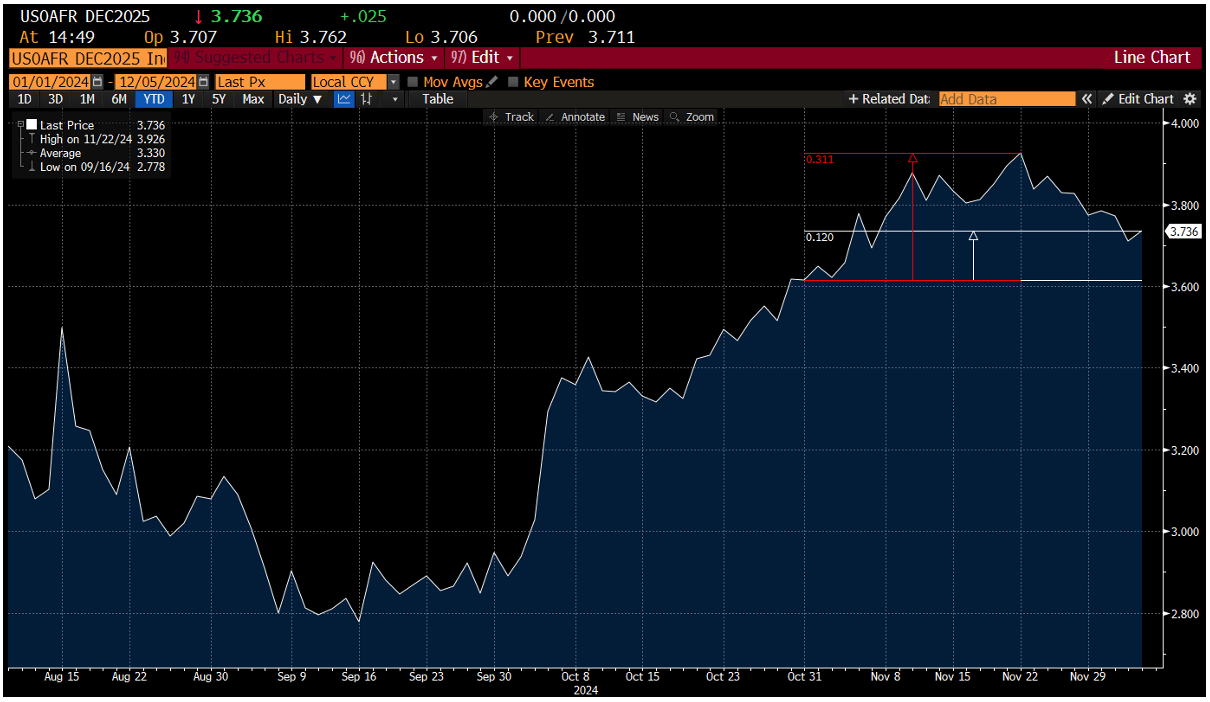
Source: Bloomberg Finance LP
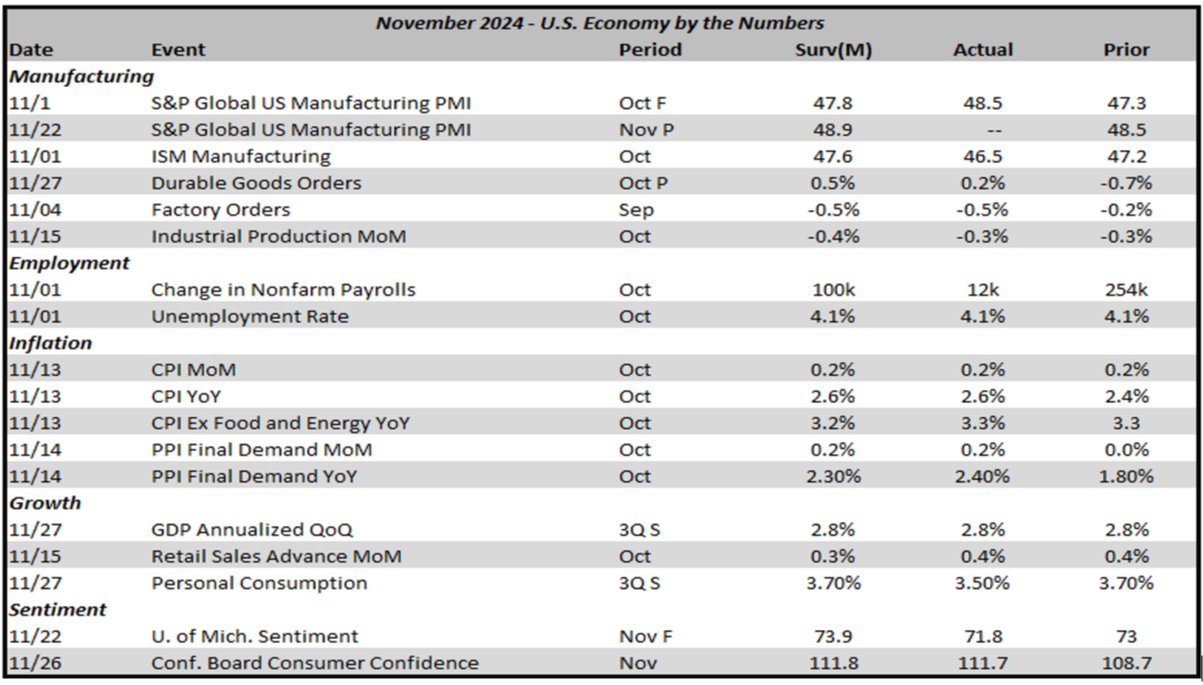
November U.S. economic data was, on average, somewhat weaker than October except for inflation, which was a little higher than expected. When taken as a whole, nothing in November economic data is viewed as enough to stop the FOMC from cutting rates in December. The bottom line, to us at least, continues to be that the economy is in decent shape (strong relative to most of the developed world) and poses no significant risk to the markets.
The Long View
As we consider the changing times, we must consider the impact. The President-elect will, assuredly, have an impact on the economy, the markets, and investment portfolios – both institutional and retail. One of the most talked about issues with the incoming administration is the prospects of tariffs. Whilst there are no formally stated policies on tariffs, the President-elect has suggested 10-20 percent blanket tariffs and a potential 60 percent tariff on goods from China.
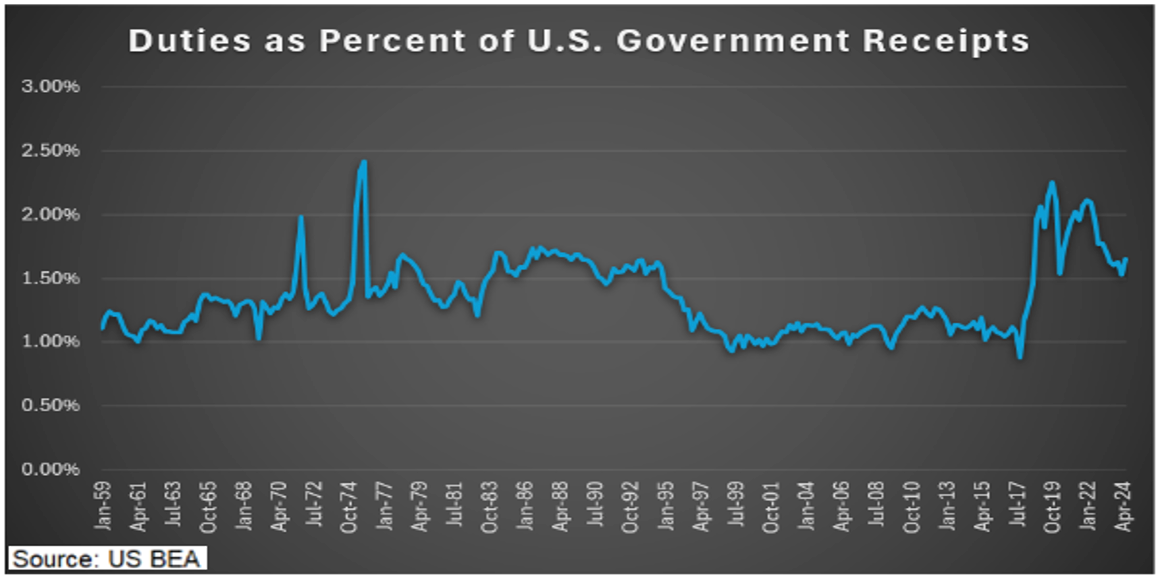
Currently, tariffs comprise approximately 1.6 percent of U.S. Federal Government receipts, with a significant portion of this amount having been a result of the tariffs implemented during the first Trump administration.
Tariffs are certainly not where the government’s bread is buttered, as they say. Compared to corporate income taxes (11 percent) and individual income taxes (49 percent) they are very small, which is shown on the next chart (interest on the debt is circled because we cannot emphasize enough how big this component is getting):
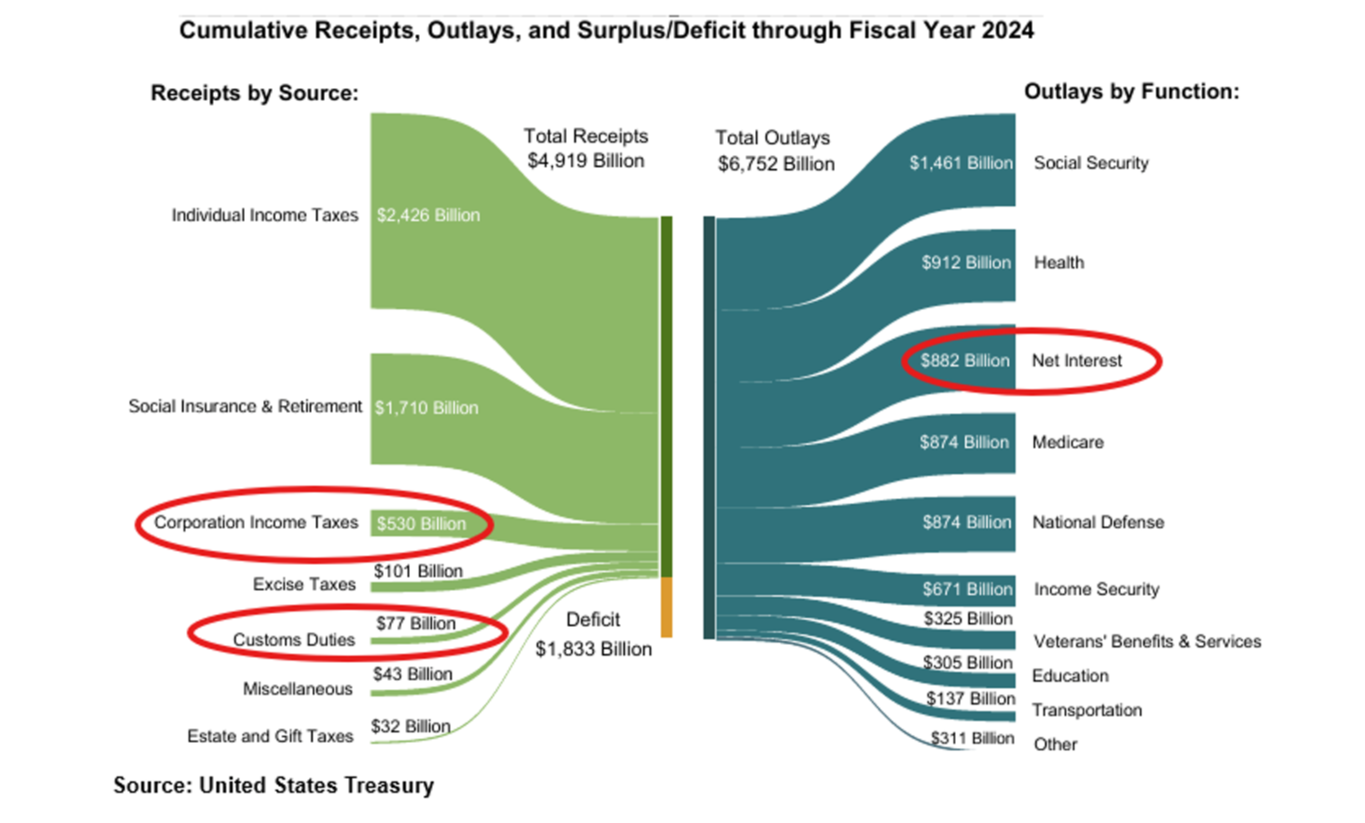
Shown a little differently:
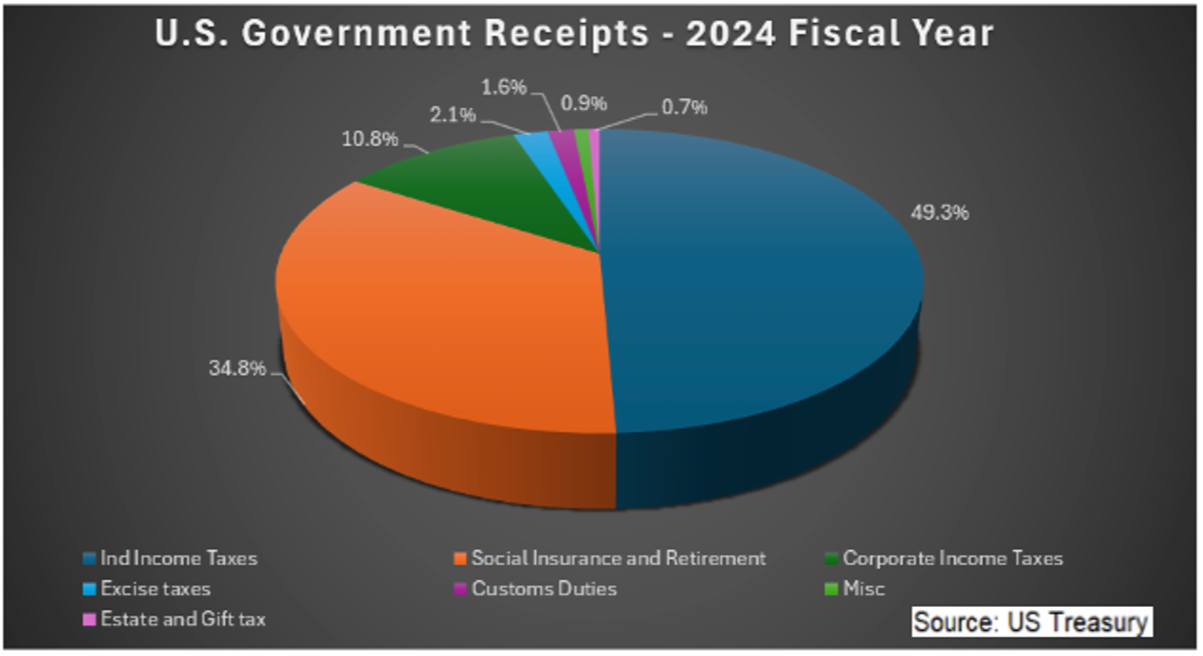
What becomes evident in these charts is that an increase in tariffs would have to be significant to offset any reduction in personal or corporate income taxes, or another source of revenues or savings would have to be found. If the reduction in receipts is not offset, the deficit increases and the amount of government debt increases (which we spotlighted last month).
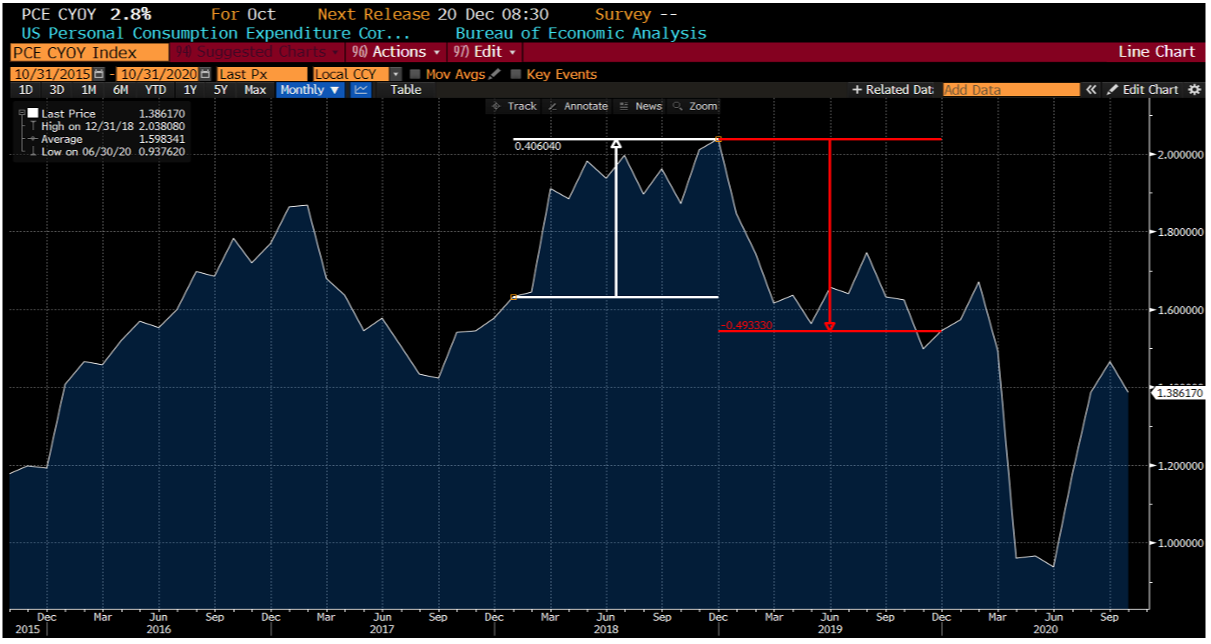
Moreover, tariffs are inflationary and will have an economic (and thus market) impact, putting upward pressure on the U.S. dollar in the process. While the inflationary impact of tariffs is difficult to measure, we can use as a guideline the inflation reaction following the tariffs put in place during President Trump’s first administration (specifically beginning in January 2018):
Source: Bloomberg Finance LP
The 40 basis point (0.40 percent) increase in personal consumption expenditures (PCE core YoY, “PCE”) during the first year of the tariffs is followed by a 49 basis point decline in PCE during months 12-24. The temporary increase in PCE (we don’t dare say “transitory”) was also expected in the Federal Open Market Committee (“FOMC”) Tealbook (report prepared for the FOMC by the staff of the board of Governors of the Federal Reserve System) expectations from September 2018, which shows the effect (directionality and timing) was consistent with expectations. The Tealbook estimated the following:
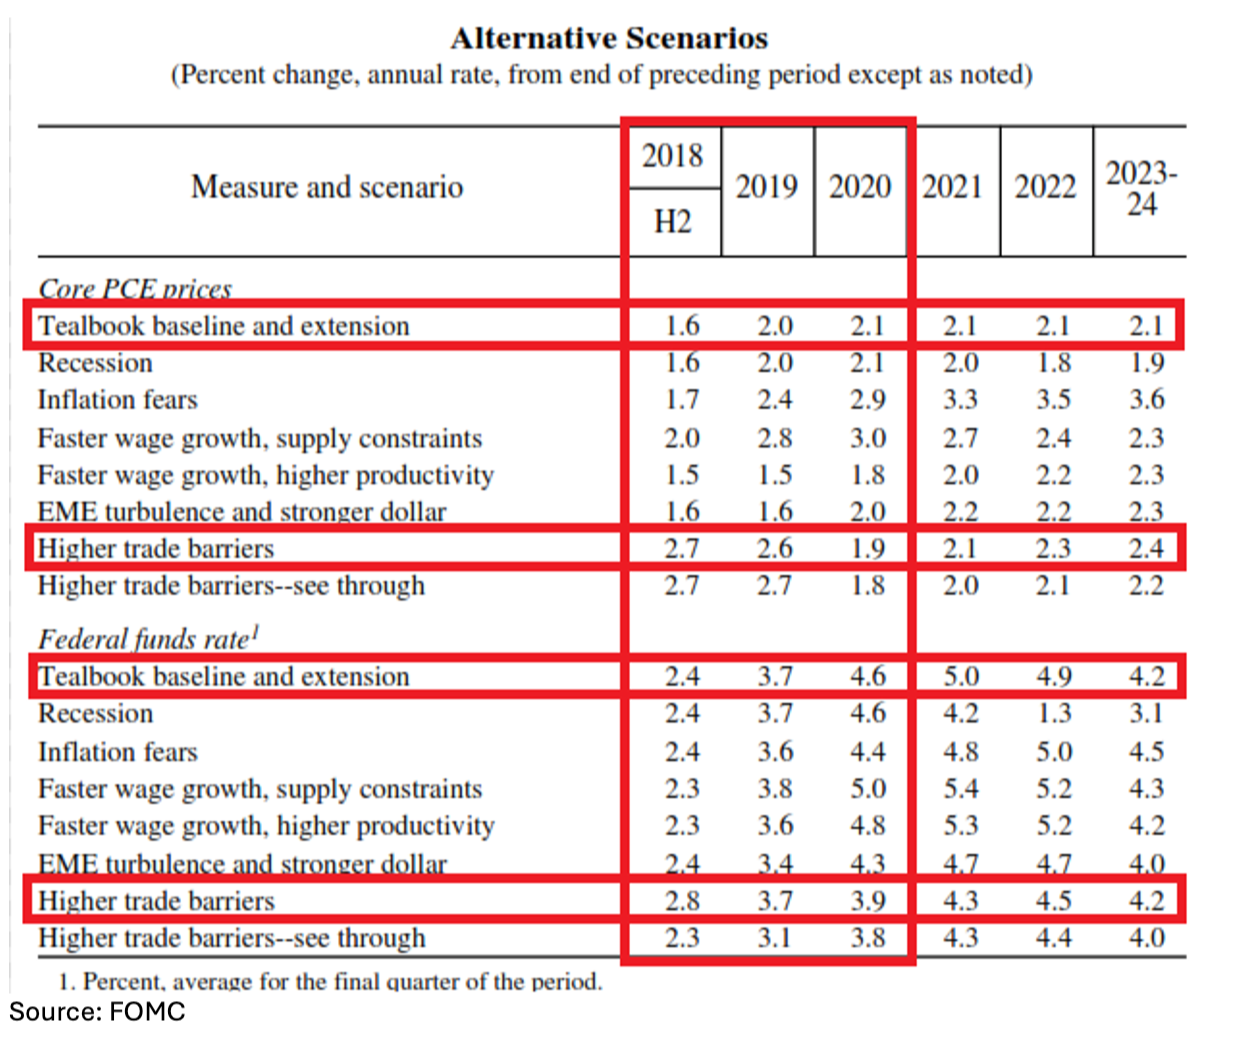
In other words, the tariff-driven rise in import prices causes core PCE inflation to surge temporarily, with federal funds reacting to the increase. Inflation subsequently falls whilst federal funds remains elevated. If this becomes the Fed’s expectation upon the imposition of new tariffs, one might expect the Fed to “see through” the increase (Tealbook scenario titled “High Trade Barriers – see through) and potentially delay a reaction. That said, if the tariffs are more significant and broad-based than the first administration, one could reasonably expect the fed to respond.
The Long View Bottom Line: Whilst we have repeatedly acknowledged that “elect me” language very often differs from policy actions, we believe that the talk of tariffs may be more than a negotiating tactic and will, in fact, become policy (amount and upon which countries is somewhat uncertain – well, except China, they will bear the brunt of policy action again) and have an inflationary impact.
As a result, it is reasonable to assume that interest rates (or more specifically, treasury rates) will not see a retreat much lower than they currently are but could increase modestly. As rates impact all financial instruments, this will serve as a headwind for financial assets, lowering expected returns. Also, the impact upon businesses through increases in feedstock costs may pressure margins and hence earnings. In other words, the climate could become more difficult from a return perspective.
November by the Numbers
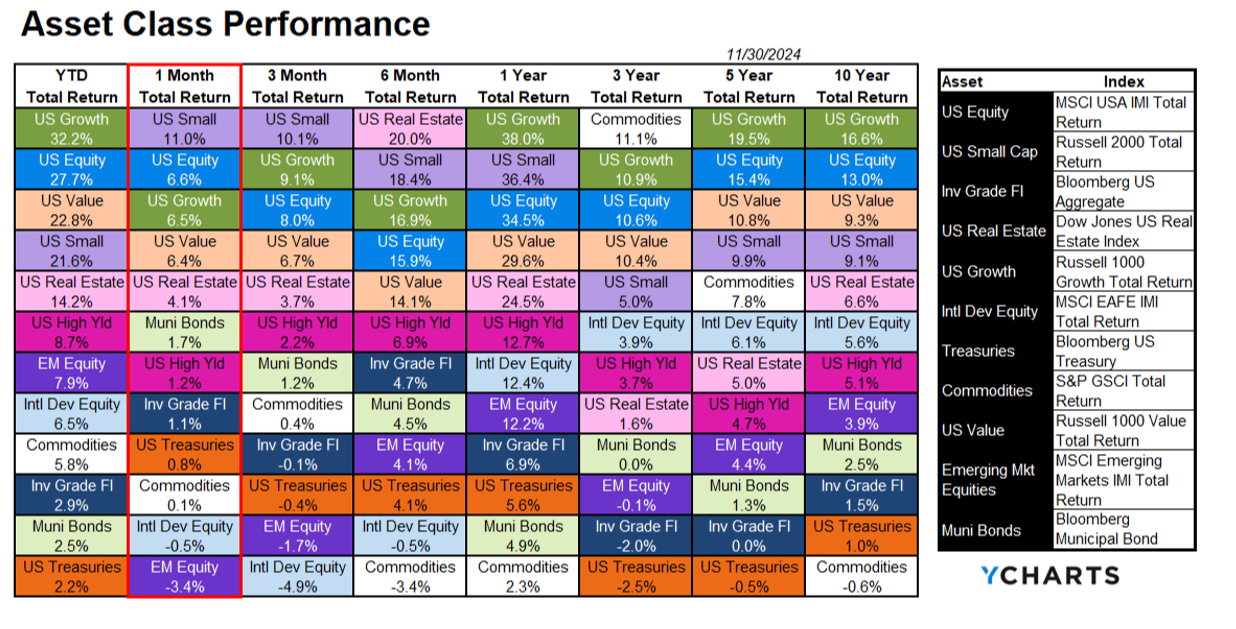
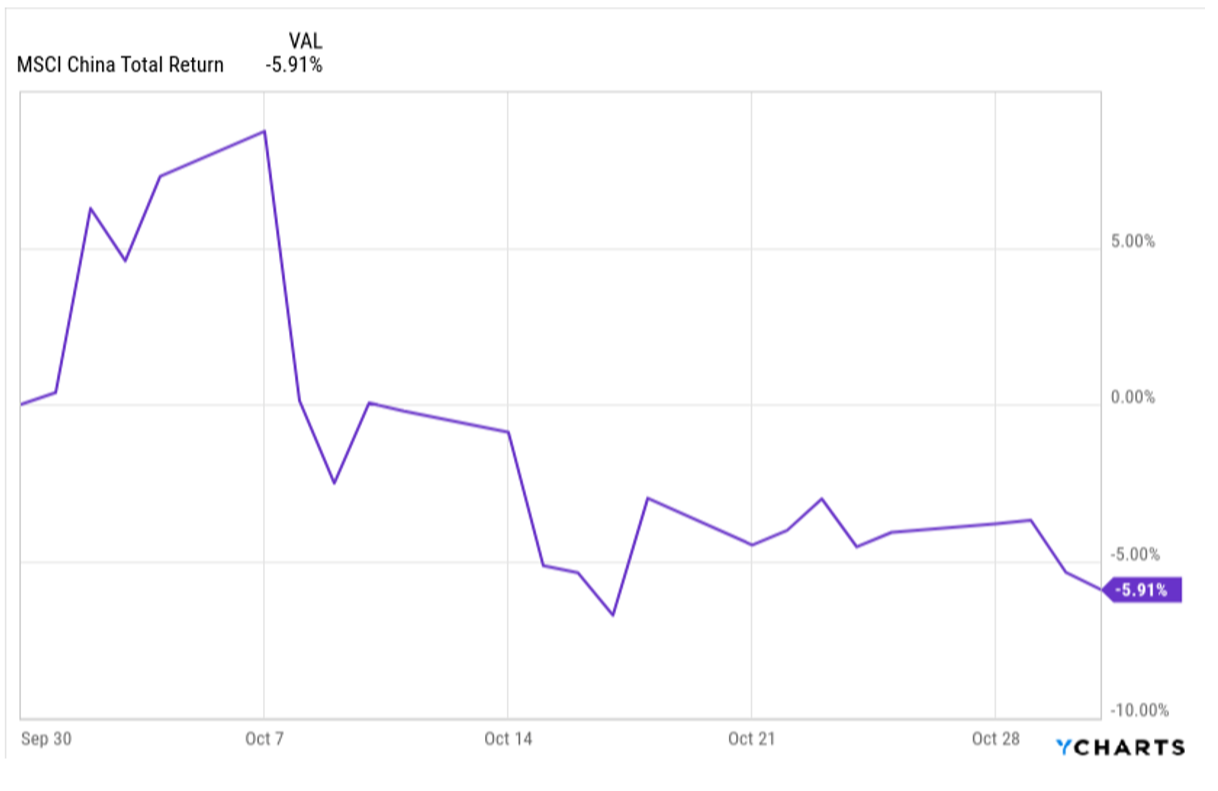
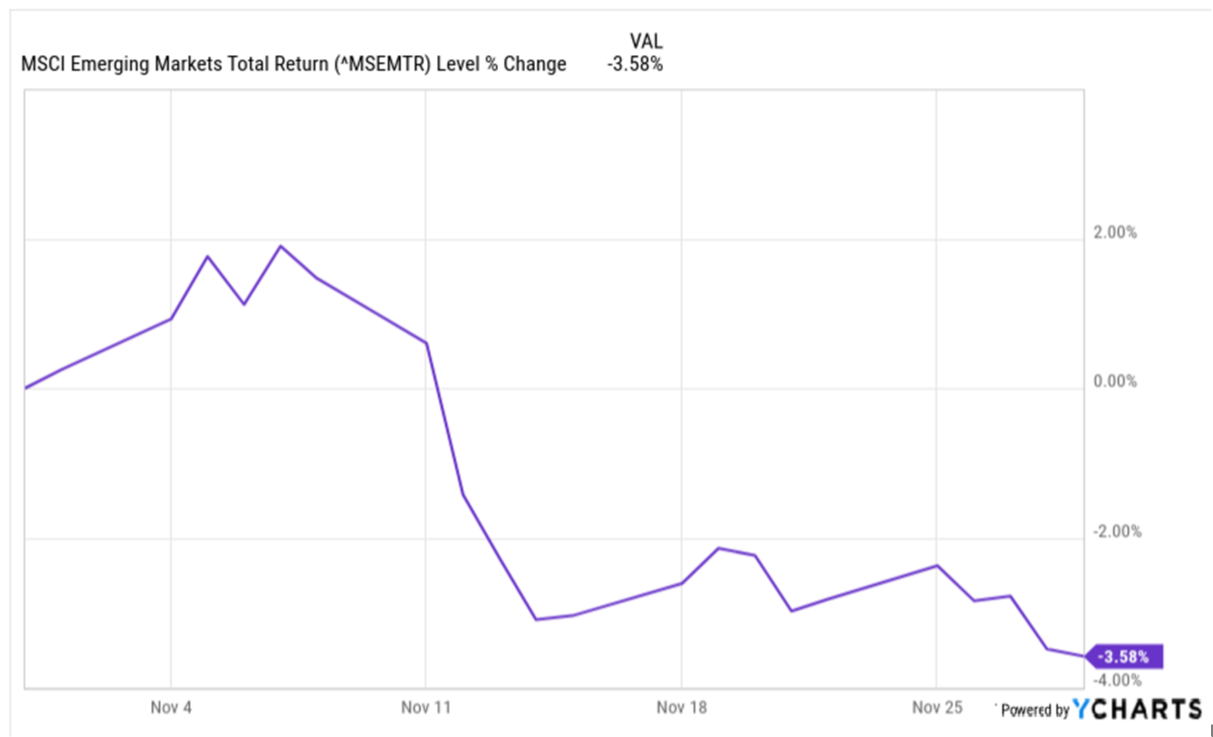
During November, domestic equity markets were the highest performing asset classes, led by small caps, whilst emerging markets (“EM”) dropped one spot to the back of the pack. International equity markets were affected by a 2.3 percent increase in the value of the U.S. dollar and a 4.5 percent drop in the Chinese market. Many have recently coined the domestic equity market a TINA market – There Is No Alternative. Whilst this is very clever, and domestic equities have indeed led the global equity markets, we continue to advocate for a diverse portfolio which includes international markets as exposure to the global opportunity set is prudent. How you take the exposure and what weight the exposure is assigned will ultimately generate solid portfolio returns. Fixed income has been consistent in its ranking as one would hope.
Equities
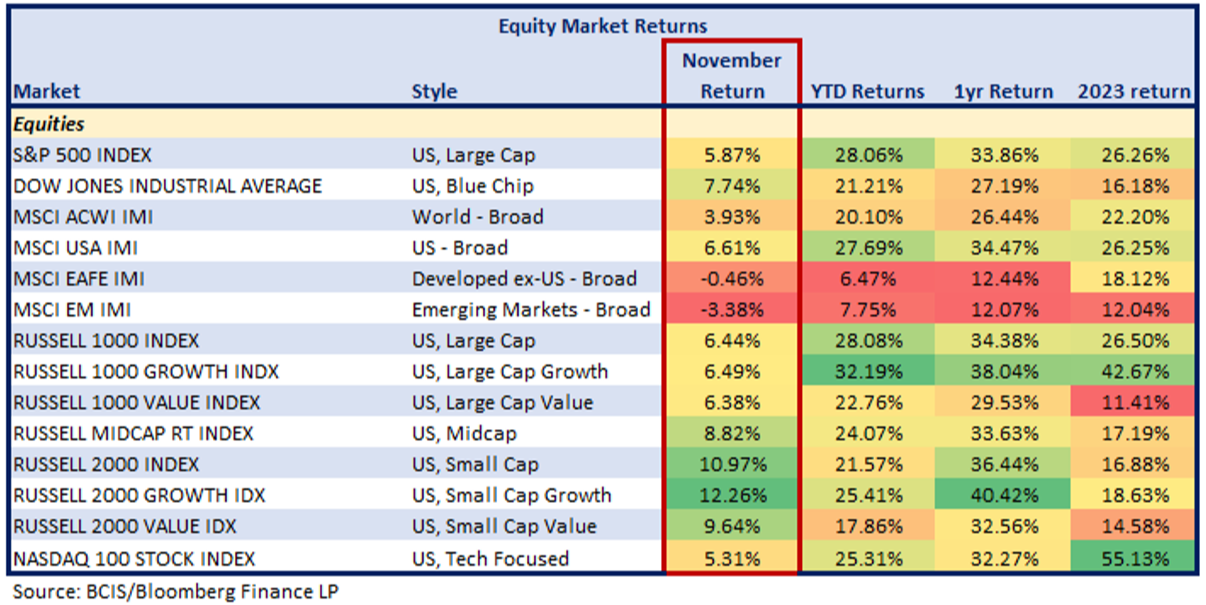
Things got rosy in November as Trump was elected a second time and the S&P 500 Index logged its best month of the year. International equities – both developed and emerging – struggled again on capital flight, a strengthening U.S. dollar, continued economic weakness in developed markets, and uncertainty regarding tariff talk.
The U.S. dollar strengthened in part to expectations of a strong dollar policy by the incoming administration, and the attractiveness of capital in the United States versus global alternatives. Anything denominated in foreign currency ran into a dollar headwind during the month.
Similar to October, the MSCI China Index ended the month lower by 4.4 percent and as it accounts for over 20 percent of the MSCI Emerging Markets Index, a negative return in China will have a significant impact on the Emerging Markets Index.
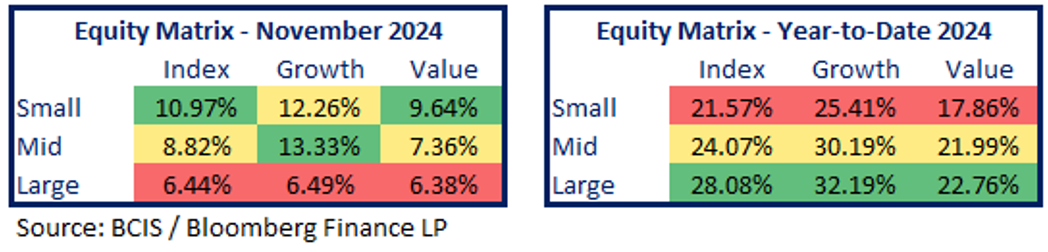
In November, midcaps once again outperformed the other U.S. capitalization buckets, driven by growth. While the megacap tech names stumbled in October, the Magnificent Seven turned in impressive returns in November as risk was “back on”. Small caps were impressive on the month as well; investors anticipate smaller companies will benefit from the “Goldilocks” scenario of easier monetary policy with good economic growth and Trump’s “America First” policy framework given they derive the vast majority of their sales domestically.
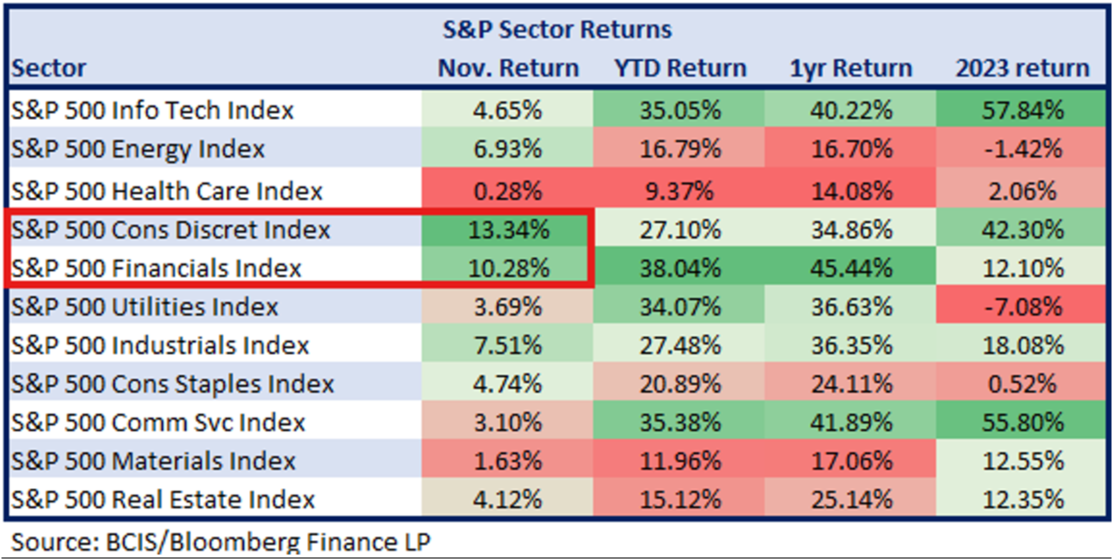
For the month we saw positive returns across all sectors on expectations of a pro-business White House and solid U.S. economic growth going forward. November saw the cyclicals lead; financials continued higher and consumer discretionary flipped from negative to positive. Healthcare was the weakest sector during the month as the biotechnology sub-sector led the sector lower.
Fixed Income
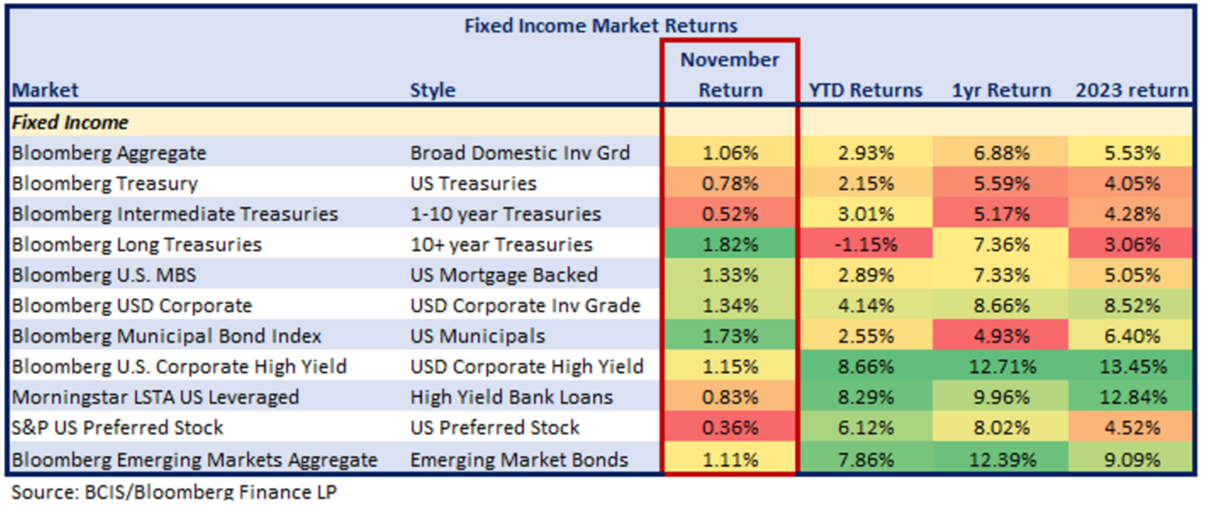
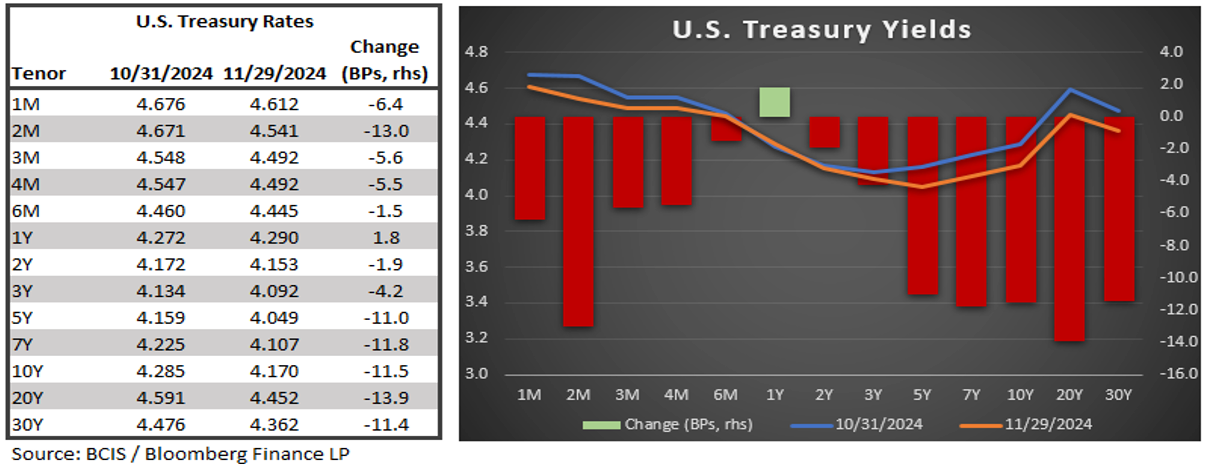
With the U.S. election(s) settled, it was “off to the races” in fixed income (well, relative to October) with spread sectors and duration leading the charge. After having initially sold off following the election, longer-dated Treasurys rallied towards the end of the month while intermediate duration languished.
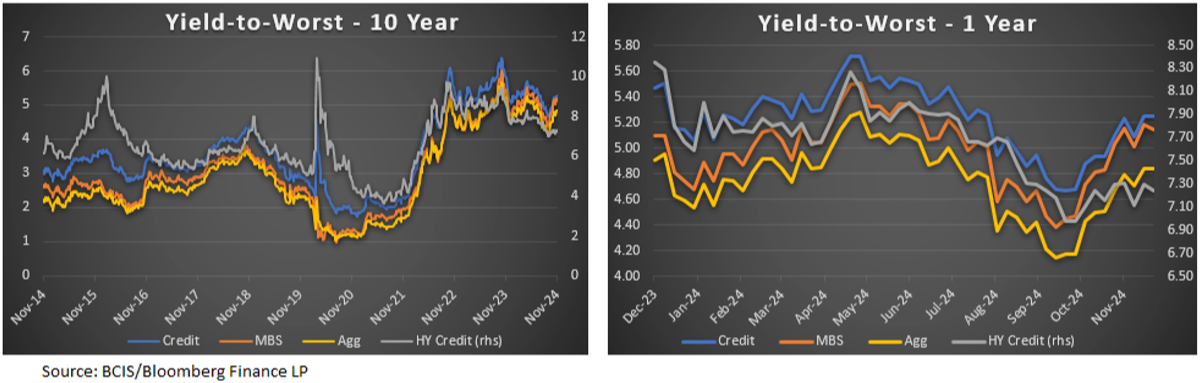
Investment grade credit spreads tightened by six basis points (“bps”) during the month and ended at 78 bps while high yield credit spreads contracted by 16 bps. Mortgage-backed securities (“MBS”) performed well, with spreads tightening by seven bps which led to the Bloomberg US Aggregate Index tightening 4 basis points from a spread perspective. We continue to have an overweight in spread sectors (MBS and credit) as we find that, while somewhat rich, the sectors are still attractive (and believe MBS will perform well when volatility settles down).
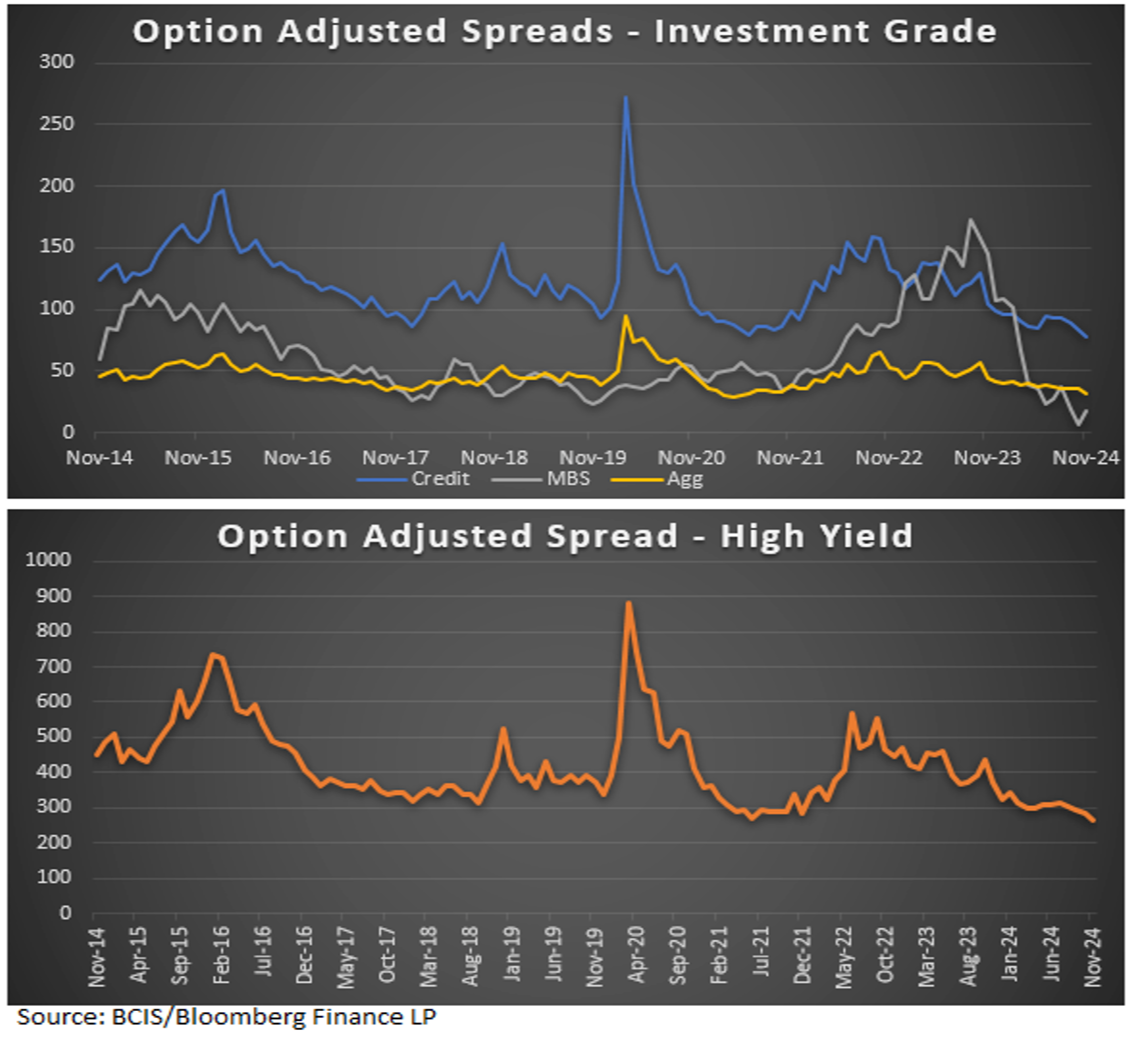
The chart below shows the yield-to-worst of the investment-grade credit, MBS, and high-yield credit indices. Yields decreased due to both tighter spreads and lower Treasury rates. Yield-to-worst is now below the year-to-date average, but still higher than the September lows.
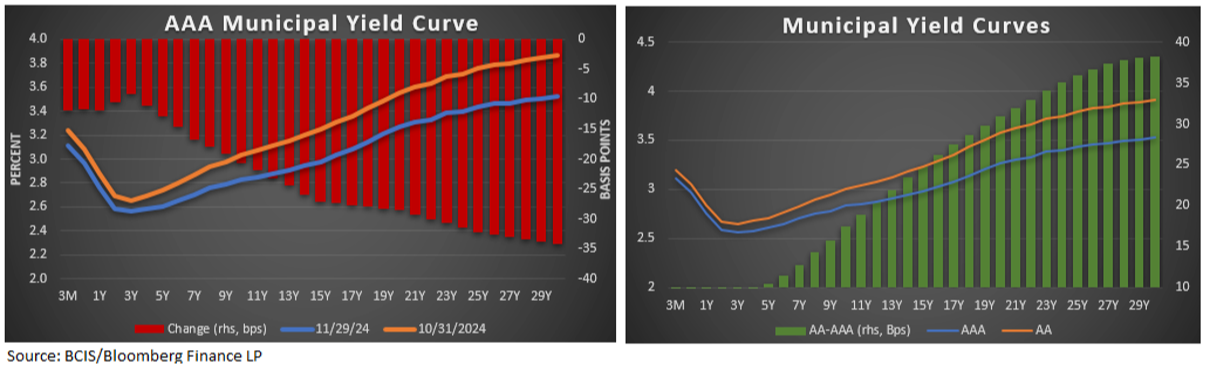
Municipal bonds, like the other sectors, saw yields fall across the curve, especially in the longer maturities (often favored by investors). As yields on municipal securities fell more than Treasurys, municipals continued to richen relative to Treasurys (municipal yield as percent of Treasury yield). Despite the relative reduction, municipal taxable equivalent yields remain above their year-to-date average. The pick-up from going into AA rated municipals from AAA rated municipals remains compelling, prompting some investors to go lower in credit for the relative value.
Summary
We continue to believe that the easy money has been made in 2024 (somewhat glib, as it hasn’t really been easy). We acknowledge that current equity valuations are not great predictors of short-term returns but have some valid prognostication power in the long-term. For fixed income, starting yields are excellent indictors of future returns as investors “earn the yield” and that yield is compelling from a risk-return perspective.
Soon, politics will become policy, but until Trump’s agenda is better understood, the impact on the market can only be hypothesized. The only thing we know with certainty is that there will be an agenda change, and with it, both opportunity and risk.
In equities, we continue to favor domestic over international equities and a balance of growth and value as the U.S. market has continued to be concentrated in a few large tech names. We think small caps and value can take advantage of the catch-up trade as they are vastly under owned compared to Large U.S. growth, but we remain concerned with ISM numbers as U.S. manufacturing remains in contraction territory. We continue to like the midcap space as well but are not yet willing to materially overweight it at the expense of the large blue chips.
Whilst we have witnessed a broadening of earnings strength within the U.S., we still haven’t identified a catalyst for outperformance of value and/or smaller-cap stocks. We do, however, recognize the tendency of these styles to outperform following a reduction in the Fed’s policy rate, but we also recognize the differing environments in which policy easing has taken place.
In international equities, we prefer emerging markets over developed markets due to the growth trajectory and fundamentals but remained concerned regarding the potential impact (or lack thereof) of stimulus efforts in China and tariff talk impact on the Southeast Asia supply chain.
In fixed income we continue to prefer spread sectors, despite the relative tightness of the credit sector. Whilst we still do not “like” the current risk premium on credit, we understand it through the lens of supply/demand and corporate balance sheets that are in decent shape. That said, we prefer to overweight intermediate duration in credit, picking up spread while controlling for duration. Moreover, we continue to believe volatility should settle in lower making MBS more attractive and laying some of the foundation for outperformance. In addition to lower volatility, we believe MBS could benefit from bank buyers should we see a relaxation in regulation under the next administration. Low yields typically result in lower returns, so investors should be cognizant of this and perhaps reduce return expectations on a go-forward basis.
While expectations might be lowered, risk-adjusted returns should still be compelling and continue to provide demand for fixed income generally. In “non-core” fixed income we continue to like emerging market debt as a diversifier for high yield, we believe bank loans should perform well (given a higher terminal rate) and are continuing to assess the preferred market for opportunities.
The bottom line is that if we look through recent volatility and the noise of the U.S. elections and uncertainty around geopolitics and global trade, fundamentals still remain mostly solid (corporate earnings, debt metrics, economic variables, etc.) which should continue to produce decent returns for investors. We do, however, caution investors against taking 2023 and 2024 equity returns and extrapolating them forward – returns cannot continue at such a pace. What can continue regardless of market cycle is an investor’s plan – adding funds where possible, prudently managing risk, keeping an eye on the future, and continuing through the noise to find some value.
About Burrows Capital Advisors
Burrows Capital Advisors (“BCA”) is a leading financial advice firm. BCA offers a comprehensive range of investment management services, thoughtfully designed to manage their clients' assets, and the risks embedded in their investment portfolios. Their long-standing commitment to risk management principles underscores their dedication to helping clients achieve their financial objectives with confidence, making them a trusted partner in the investment management industry. Comprehensive services include: wealth management solutions, retirement plan solutions, advisory services, practice management support, innovative technology, marketing guidance, regulatory support, and market research.
Burrows Capital Advisors, LLC is headquartered in League City, TX in the Greater Houston metro. BCA is located at 2450 South Shore Blvd., Suite 220 League City, TX 77573.
Disclosures
The views expressed in this publication are those of the author and do not necessarily reflect the views and opinions of Cetera Advisor LLC or Burrows Capital Advisors.
The information provided in this publication is for informational purposes only and is not intended as legal, financial, investment, tax, or professional advice. Nothing in this publication constitutes a solicitation, recommendation, endorsement, or offer by Burrows Capital Advisors or any affiliated entities. This publication is based on research and analysis conducted under specific circumstances and may not be applicable to all situations. It is recommended that investors conduct their own analysis or seek professional advice before making any decisions based on the information provided in this publication. The authors and publisher do not guarantee the completeness or suitability of the information contained herein and disclaim any liability for any direct, indirect, or consequential loss or damages arising from the use of, reliance on, or interpretation of this information. Any links to external websites provided in this publication are for informational purposes only and do not imply endorsement or approval of the linked content.
Investments in securities do not offer a fixed rate of return. Principal, yield and/or share price will fluctuate with changes in market conditions and, when sold or redeemed, you may receive more or less than originally invested. No system or financial planning strategy can guarantee future results. Therefore, no current or prospective client should assume that future performance or any specific investment, investment strategy or product will be profitable. Investors cannot directly invest in indices. Past performance does not guarantee future results.
Securities offered through Cetera Advisors LLC, member FINRA/SIPC. Advisory services offered through Cetera Investment Advisers LLC, a Registered Investment Adviser. Cetera firms are under separate ownership from any other named entity.
All rights are reserved. No part of this publication may be reproduced, stored in a retrieval system, or transmitted in any form or by any means, electronic, mechanical, photocopying, recording, or otherwise, without the prior written permission of the authors and publisher.
Glossary:
Investors cannot invest directly in indexes. The performance of any index is not indicative of the performance of any investment and does not take into account the effects of inflation and the fees and expenses associated with investing.
The Bloomberg USAgg Index is a broad-based flagship benchmark that measures the investment grade, US dollar-denominated, fixed-rate taxable bond market. The index includes Treasuries, government-related and corporate securities, MBS (agency fixed-rate pass-throughs), ABS and CMBS (agency and non-agency).
The Bloomberg GlobalAgg Index is a flagship measure of global investment grade debt from a multitude local currency markets. This multi-currency benchmark includes treasury, government-related, corporate and securitized fixed-rate bonds from both developed and emerging markets issuers.
The Bloomberg US Corporate Bond Index measures the investment grade, fixed-rate, taxable corporate bond market. It includes USD denominated securities publicly issued by US and non-US industrial, utility and financial issuers.
The Bloomberg US Mortgage-Backed Securities (MBS) Index tracks fixed-rate agency mortgage backed pass-through securities guaranteed by Ginnie Mae (GNMA), Fannie Mae (FNMA), and Freddie Mac (FHLMC). The index is constructed by grouping individual TBA-deliverable MBS pools into aggregates or generics based on program, coupon and vintage.
The Bloomberg US Corporate High Yield Bond Index measures the USD-denominated, high yield, fixed-rate corporate bond market. Securities are classified as high yield if the middle rating of Moody's, Fitch and S&P is Ba1/BB+/BB+ or below. Bonds from issuers with an emerging markets country of risk, based on Bloomberg EM country definition, are excluded.
The Emerging Market Bond Index Global (EMBI Global) was the first comprehensive EM sovereign index in the market, after the EMBI+. It provides full coverage of the EM asset class with representative countries, investable instruments (sovereign and quasisovereign), and transparent rules. The EMBI Global includes only USD-denominated emerging markets sovereign/quasi-sovereign bonds and uses a traditional, market-capitalization weighted method for country allocation.
The Morningstar LSTA US Leveraged Loan Index is a market-value weighted index designed to measure the performance of the US leveraged loan market
The MSCI ACWI captures large and mid-cap representation across 23 Developed Markets (DM) and 24 Emerging Markets (EM) countries. With 2,921 constituents, the index covers approximately 85% of the global investable equity opportunity set.
The S&P 500 is an index of 500 stocks chosen for market size, liquidity and industry grouping (among other factors) designed to be a leading indicator of U.S. equities and is meant to reflect the risk/return characteristics of the large cap universe.
The Dow Jones Industrial Average tracks 30 large, well-known blue-chip stocks trading on the New York Stock Exchange. It is price weighted.
The Russell 1000 Index measures the performance of the large-cap segment of the US equity universe. It is a subset of the Russell 3000® Index and includes approximately 1,000 of the largest securities based on a combination of their market cap and current index membership. The Russell 1000 represents approximately 93% of the Russell 3000® Index, as of the most recent reconstitution.
The Russell 1000 Growth Index measures the performance of the large-cap growth segment of the US equity universe. It includes those Russell 1000 companies with relatively higher price-to-book ratios, higher I/B/E/S forecast medium term (2 year) growth and higher sales per share historical growth (5 years).
The Russell 1000 Value Index measures the performance of the largecap value segment of the US equity universe. It includes those Russell 1000 companies with relatively lower price-to-book ratios, lower I/B/E/S forecast medium term (2 year) growth and lower sales per share historical growth (5 years).
The Russell 2000 Index measures the performance of the small-cap segment of the U.S. equity universe and is a subset of the Russell 3000 Index representing approximately 10% of the total market capitalization of that index. It includes approximately 2000 of the smallest securities based on a combination of their market cap and current index membership.
The Russell 2000® Growth Index measures the performance of the smallcap growth segment of the US equity universe.
The Russell 2000® Value Index measures the performance of the smallcap value segment of the US equity universe.
The Russell 3000 Index measures the performance of the largest 3,000 U.S. companies representing approximately 98% of the investable U.S. equity market.
The Nasdaq 100 Index is a stock index of the 100 largest companies by modified market capitalization trading on Nasdaq exchanges. The index includes companies in basic materials, consumer discretionary spending, consumer staples, healthcare, industrials, technology, telecommunications, and utilities. The index excludes financial firms.
The MSCI ACWI Index is a free-float weighted equity index. The MSCI ACWI captures large and mid-cap representation across 23 Developed Markets (DM) and 24 Emerging Markets (EM) countries*. With 2,837 constituents, the index covers approximately 85% of the global investable equity opportunity set
The MSCI ACWI ex USA Index captures large and mid-cap representation across 22 of 23 Developed Markets (DM) countries (excluding the US) and 24 Emerging Markets (EM) countries*. With 2,226 constituents, the index covers approximately 85% of the global equity opportunity set outside the US.
The MSCI EAFE Index is designed to measure the equity market performance of developed markets (Europe, Australasia, Far East) excluding the U.S. and Canada. The Index is market-capitalization weighted.
The MSCI Emerging Markets Index captures large and mid-cap representation across 24 Emerging Markets (EM) countries. With 1,441constituents, the index covers approximately 85% of the free float-adjusted market capitalization in each country.
The MSCI US REIT Index is a free float-adjusted market capitalization weighted index that is comprised of equity REITs that are included in the MSCI US Investable Market 2500 Index, with the exception of specialty equity REITs that do not generate a majority of their revenue and income from real estate rental and leasing operations. The index represents approximately 85% of the US REIT universe.